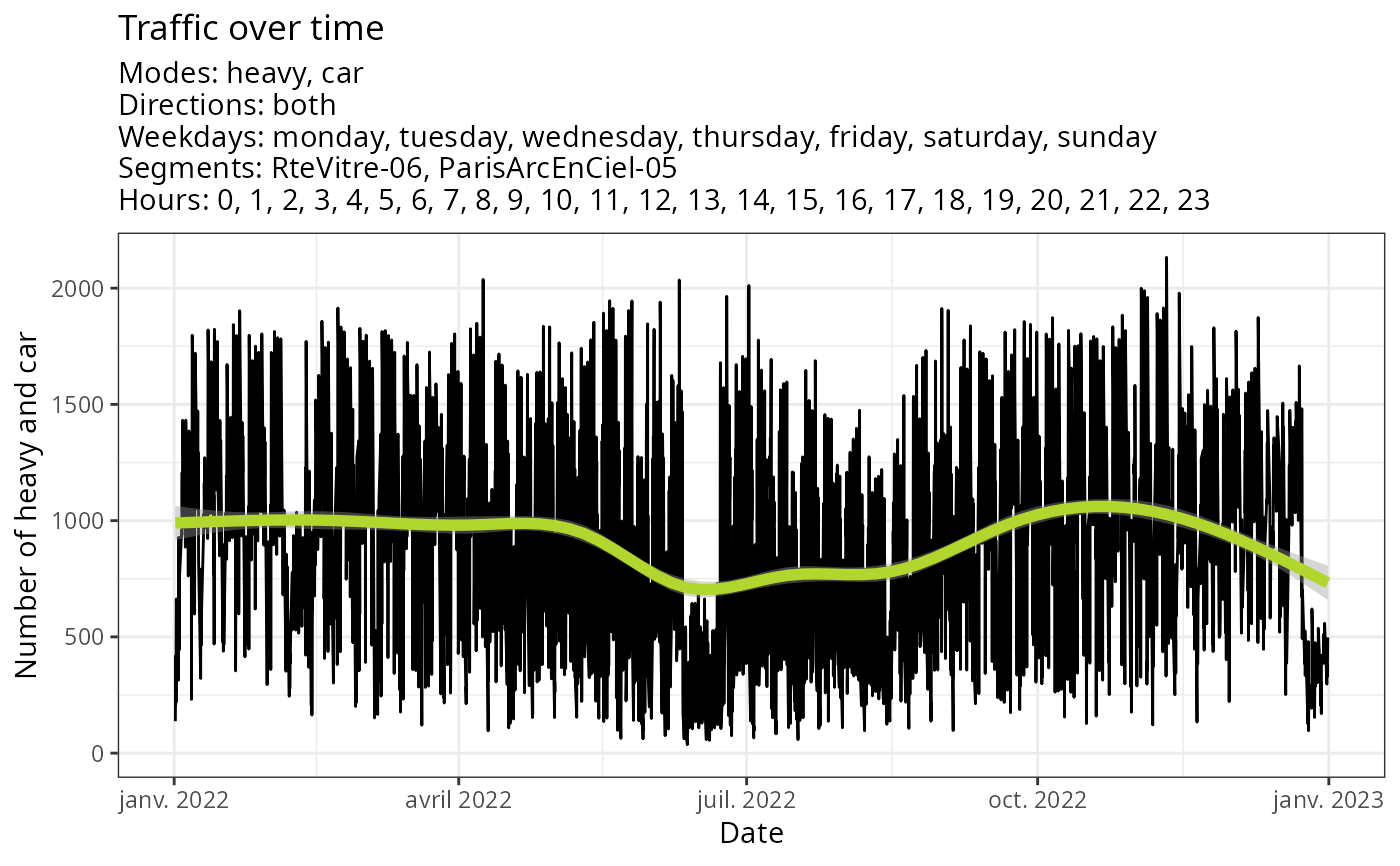
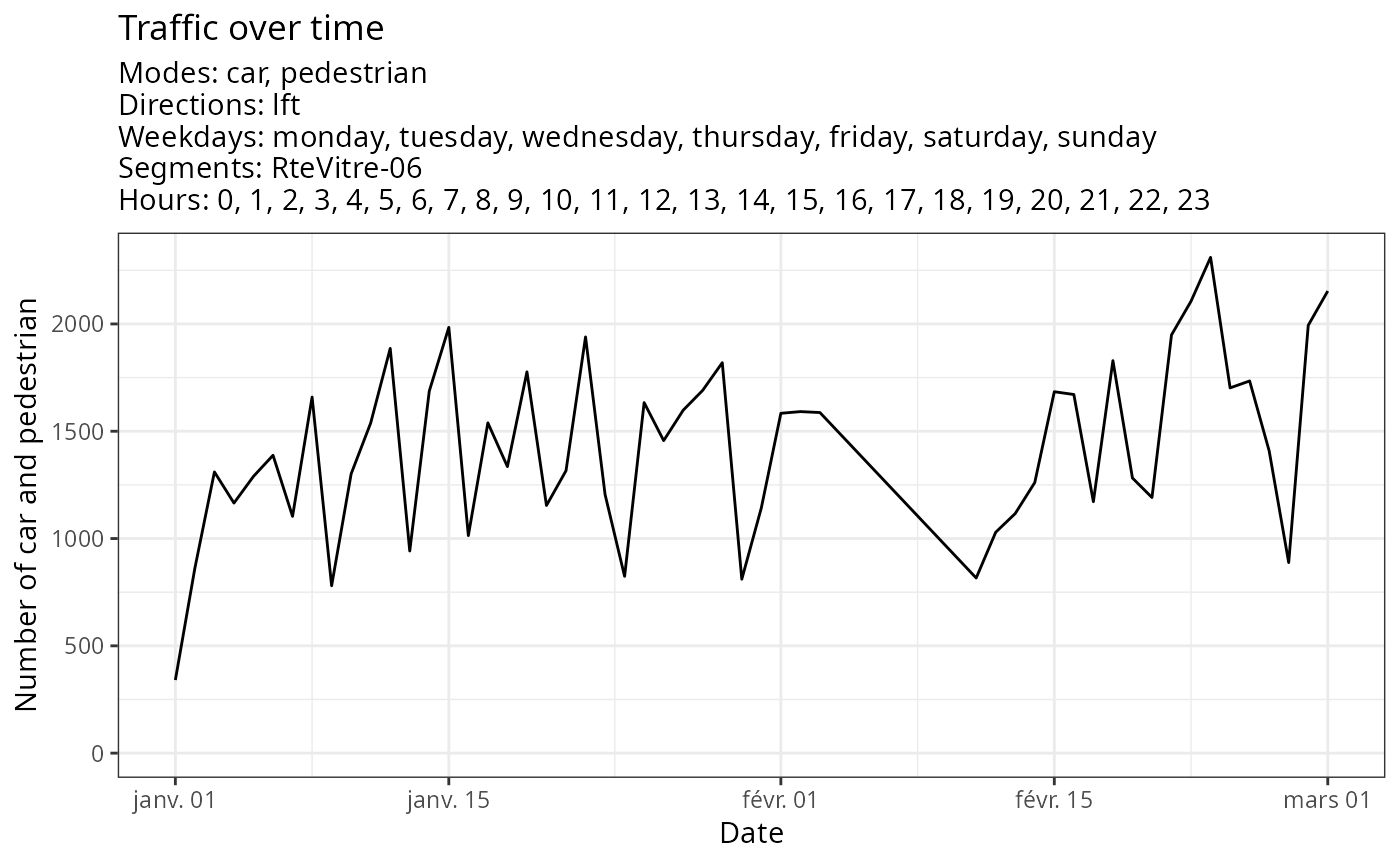
Evolution of traffic and smoothed traffic.
Source:R/plot_evolution_traffic.R
gg_traffic_evolution.RdEvolution of traffic (global, per mode ou per direction), smoothed traffic during a period.
Usage
gg_traffic_evolution(
  enriched_data,
  date_range = NULL,
  segments = NULL,
  modes = c("heavy", "car"),
  direction = "both",
  smoothed = TRUE,
  agg_day = TRUE
)
Arguments
- enriched_data
enriched data.frame containing all the data for all your sensors
- date_range
Date vector. Example: c('2021-01-01','2022-01-01'). Full period if NULL (default).
- segments
Character vector. Selected road segment by its name, all if NULL (default).
- modes
Character vector. Different modes of transportation aggregated (heavy, car, bike, pedestrian) . Default: heavy & car
- direction
Character. Direction of the traffic (lft, rgt, both). Default to both.
- smoothed
Boolean. Should the smoothed traffic be plotted ? Default: True
- agg_day
Boolean. Should the data be aggregated per day ? Default : True

